
The Fundamentals of Construction Gantt Charts


Last Updated Jul 24, 2026
Ben Ashburn
Staff Trainer & Program Manager
22 articles
Ben Ashburn is a Senior Construction Education Trainer at Procore. After a successful career as a construction estimator — working his way up from estimating manager to senior estimator — Ben has spent the most recent part of his career in construction sharing his skills with other as a construction educator. Ben has an extensive background in construction education: He has been an assistant professor in the Department of Construction Science at Texas A&M, and lectured about estimating, scheduling, management, and other related construction topics at Murray State University. He has been a construction training and learning development partner with Procore since 2019.
James Hamilton
Writer & Producer
89 articles
James Hamilton is a writer based in Brooklyn, New York with experience in television, documentaries, journalism, comedy, and podcasts. His work has been featured on VICE TV and on The Moth. James was a writer and narrator for the show, VICE News Tonight, where he won an Emmy Award and was nominated for a Peabody Award.

Even before project managers and general contractors are done planning a project, they need to be able to effectively communicate about those plans with everyone involved with the project. Tools for project management should ideally help with both of those things: thoroughly planning and managing complex projects, while also helping to keep owners, subcontractors, and other stakeholders informed and up-to-date.
A Gantt chart is a bar chart that displays a project’s activities along the project's timeline. They are common and effective tools for people trying to manage construction projects and complete them on time and on budget. Gantt charts are updated throughout the life of a project and are often prominently displayed on jobsites to keep stakeholders informed.
At their simplest, Gantt charts are a visual tool to plan projects and sequence tasks. They display each activity's duration and dependency on other activities. However, Gantt charts can be valuable tools for project scheduling, budgeting, material management, and progress tracking.
This article explores Gantt charts, including their components, how they can help a project — and how they can complement other planning methods.
Table of contents
What makes a Gantt chart?
Gantt charts create visual representations of activities that need to be completed, and can be used for managing whole projects or phases and segments. Commonly, project managers (PMs) will display or share one Gantt chart showing the up-to-date status of the project, and a lookahead showing the next three weeks of work.
The activities and tasks displayed on a Gantt chart are defined and established in the work breakdown structure (WBS). Most planning software programs can generate a Gantt chart using the activities from the WBS, their duration, and any contingencies.
While most Gantt charts look slightly different based on the program used to make them, they almost always:
- are divided by time, usually days, weeks, or months depending on the size of the project and whether the Gantt chart is showing a whole project or a segment of work
- use a bar to represent each activity in the schedule
- run left to right, with each bar starting at the activity’s start date and stretching to the end date
- stacks the activities and sequences them on the timeline in the order they need to be done
- convey relationships between activities, usually by connecting activities that are dependent upon each other
Stay updated on what’s happening in construction.
Subscribe to Blueprint, Procore’s free construction newsletter, to get content from industry experts delivered straight to your inbox.

Components of a Gantt Chart
A Gantt chart typically includes information such as activities, a timeline, durations, dependencies and milestones. Here is more detail about each element:
Activities
Each vertical bar should represent a different task or activity within the project or the segment. These activities are often identified when creating the WBS.
Timeline
The horizontal axis of the chart represents time, and is usually broken into days, weeks or months, depending on the scale of the project and whether the chart is showing the whole project or a segment.
Durations
Each activity’s bar will stretch from its start date to finish date, which are both easily identified on the timeline.
Dependencies and Predecessors
Arrows or lines often connect the bars to indicate dependencies or other relationships between tasks.
Milestones
Milestones are significant points in the project, such as the completion of a phase or a key deliverable. These are often marked in Gantt charts with diamond shapes to set them apart from other activities. Some shorter-term Gantt charts will focus on the tasks and activities needed to be done between milestones.
The example below is from a project to build a small office building. The Gantt chart is for the segment of completing the interior of the building, which shows all tasks required to move the project from one milestone (completing the foundation) to the next milestone.

The Value of Gantt Charts
Having a visual representation of activities and their sequencing can obviously help with project planning, but Gantt charts can help with other parts of project management as well.
Monitor progress.
Gantt charts should be regularly updated throughout a project, often as regularly as every day.
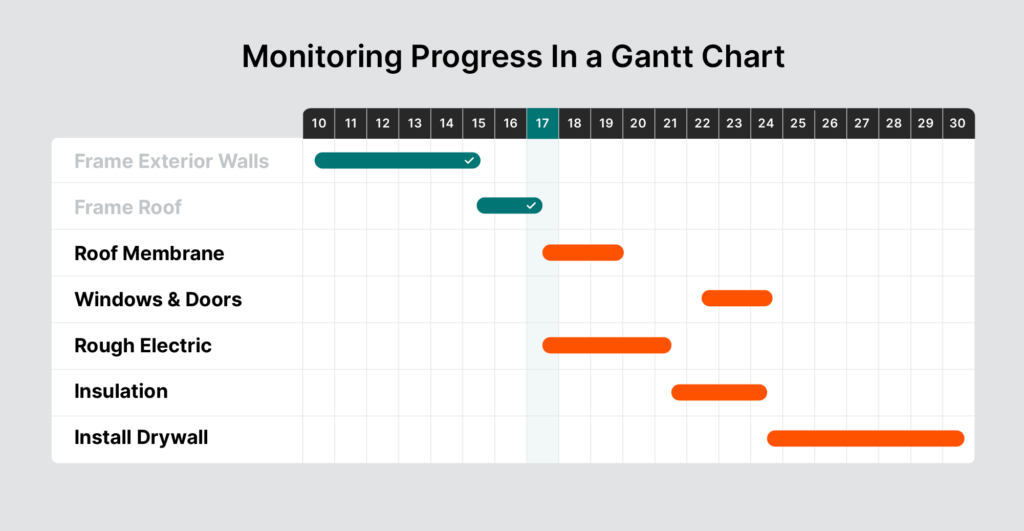
The updating process helps PMs and general contractors (GCs) monitor how a project is progressing compared to what level of completion it was scheduled to be at. When issues arise, the Gantt chart can help plan solutions and understand how potential solutions might impact other parts of a project. Gantt charts can also be helpful for monitoring and communicating progress as it relates to payments and billing.
Using the example of the office interior again, this is an updated Gantt chart that could be displayed on Day 17. The framing exterior walls and framing the roof were both completed on time, so they’ve been removed and the chart only shows the remaining tasks. Also, because of an issue procuring materials, the task of installing the windows and doors has been bumped back to starting on day 22 and ending on day 24. This can be done without adjusting the start date of installing the drywall.
Identify task dependencies and concurrencies.
Gantt charts visually represent the sequence of activities and their respective durations, which helps to understand which tasks are dependent on each other and which ones can happen at the same time. This can help with scheduling, material management, and budgeting.
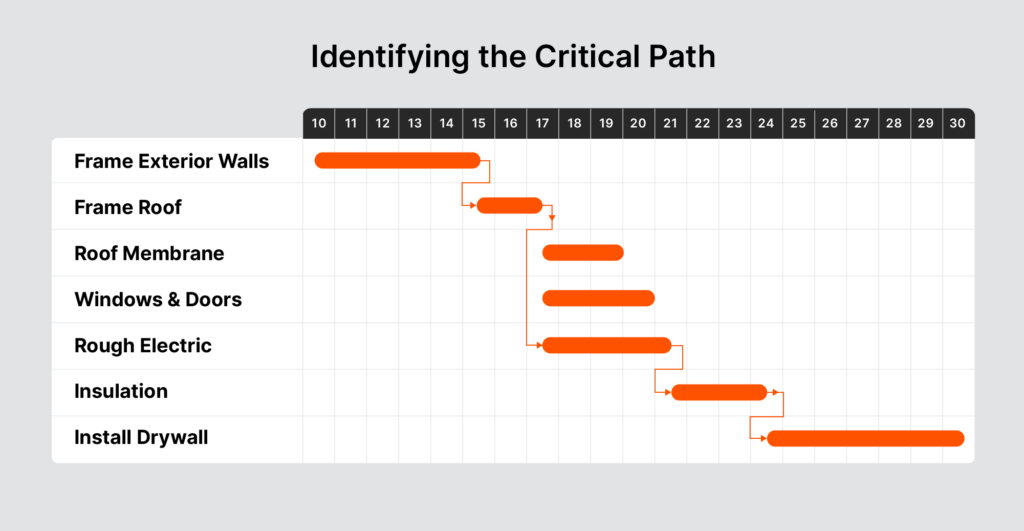
Many Gantt charts use arrows to connect an activity to other tasks that are dependent on its completion. Gantt charts can be helpful in showing a project’s critical path, which is the sequence of tasks that are most critical for the project to be delivered on time.
In the example of the office interior, arrows show what activities are dependent on each other and the highlighted tasks show the critical path. The tasks of installing the roof membrane, the windows and doors, and the rough electric are all dependent on the completion of framing the roof, but can all be done concurrently.
Build and manage a budget.
By aligning tasks on a timeline, Gantt charts can be used to help create estimates and track budgets for tasks, segments, and trades on a weekly, monthly, or quarterly basis. Some Gantt charts will include an activity’s costs and be linked to a budget, where PMs and GCs can monitor and manage what they are paying and when.
Improve communication.
Gantt charts improve communication by visually presenting project progress and task relationships, making information easier to understand. Gantt charts are often displayed around construction job sites for everyone to see. Many document management programs or scheduling tools allow for Gantt charts to be shared digitally. This helps stakeholders, including owners, understand how the project is progressing. It also helps subcontractors understand how their work connects to the larger project and the work of other trades, which can increase urgency and accountability.
Plan short-term and long-term.
Many software programs can easily create Gantt charts for whole projects as well as segments or phases of work. Commonly, PMs will display an updated Gantt chart showing a whole project as well as one showing the lookahead, which can be used by the superintendent to prepare the job site and execute all tasks.
Creating a Gantt Chart
The two most common software programs for creating Gantt charts are Microsoft Project and Primavera 6. Those programs can be integrated into construction software management systems, such as Procore, and import activities from the WBS. Those activities and their durations are used to generate a Gantt chart.
These programs allow schedules and charts to be shared with many project management tools, including Procore. From there, charts can be integrated into a project’s budget, plans, and shared with stakeholders.
How Gantt Charts Help Inform Other Planning Methods
Gantt charts can be used as complementary pieces for many different types of planning methods and tools in construction.
Building Information Modeling (BIM)
Building Information Modeling, or BIM, allows for the virtual creation of three-dimensional project models, which can enhance planning and catch potential issues before they happen. Some BIM tools integrate the schedule data found in a Gantt chart into the 3D model, when combined then become known as a 4D model, and allows objects in the model to display planning information, such as duration or description of work.
Critical Path Method
The Critical Path Method (CPM) is a way of sequencing tasks and identifying the critical path, which is the sequence of tasks that are most critical for the project to be delivered on time.
Gantt charts are often an alternative way of illustrating or visualizing the critical path. CPM uses nodes and arrows to show the sequencing of tasks, while Gantt charts use bars and arrows.
Gantt Charts Best Practices
To maximize effectiveness, Gantt charts should be regularly updated, used to identify task dependencies, and integrated into budget and communications protocols. The following common practices can make Gantt charts as helpful as possible.
Create a Work Breakdown Schedule
To create a work breakdown structure (WBS), you divide a complex project into smaller, more manageable tasks, that then can form the basis of a Gantt chart. A WBS is a thorough and effective project management technique used to determine the parts or phases of a project that need to be completed.
Regularly Update and Monitor
Gantt charts are only helpful if they are constantly updated, sometimes as regularly as daily. Posting charts at a job site with the project’s most up-to-date information and status keeps them relevant and turns them into references that stakeholders can use to improve decision making, solve problems, and stay on schedule.
Identify Float Time
Identifying float time involves building in extra time for tasks or phases to create flexibility that can later be used to address issues without falling behind schedule.
Whether it’s in material procurement or bad weather, most projects come up against some type of unexpected delay. When delays arise, Gantt charts can become useless or actively add stress if activities have been planned as tightly as possible. Identifying float time for tasks or phases and, when possible, building in extra time can create space later during construction that can be used to address issues without falling behind.
The Timelessness of Gantt Charts
At their core, Gantt charts meet a simple need: to visually represent the flow of a project and its timeline. This is something people needed long before computers made it so easy to do, and it's why Gantt charts were created in the first place. That need will remain in the future and Gantt charts will remain an effective tool for planning and communication, even as artificial intelligence and automation become more prevalent and helpful in project management.
Was this article helpful?
Scroll less, learn more about construction.
Subscribe to The Blueprint, Procore’s construction newsletter, to get content from industry experts delivered straight to your inbox.
By clicking this button, you agree to our Privacy Notice and Terms of Service.
Categories:
Written by
Ben Ashburn
Staff Trainer & Program Manager | Procore Technologies
22 articles
Ben Ashburn is a Senior Construction Education Trainer at Procore. After a successful career as a construction estimator — working his way up from estimating manager to senior estimator — Ben has spent the most recent part of his career in construction sharing his skills with other as a construction educator. Ben has an extensive background in construction education: He has been an assistant professor in the Department of Construction Science at Texas A&M, and lectured about estimating, scheduling, management, and other related construction topics at Murray State University. He has been a construction training and learning development partner with Procore since 2019.
View profileJames Hamilton
Writer & Producer
89 articles
James Hamilton is a writer based in Brooklyn, New York with experience in television, documentaries, journalism, comedy, and podcasts. His work has been featured on VICE TV and on The Moth. James was a writer and narrator for the show, VICE News Tonight, where he won an Emmy Award and was nominated for a Peabody Award.
View profileExplore more helpful resources

Who is accountable for innovation in construction?
Everyone says construction needs to innovate—but no one agrees on who’s actually responsible for making it happen. Is it the owner? The builders? The tech vendor? Or is innovation everyone’s...

How Are Partnerships in Construction Being Redefined?
In a market where cost, speed, and quality are table stakes, owners are demanding more than projects delivered on time and on budget. They want trusted partners who bring strategy,...
What Does Construction Leadership Look Like in the Age of AI?
In this episode of The Power of Construction, hosts Sasha Reed and Andy Rampton examine how AI is reshaping leadership across industries. Guests Fiona Wilhelm, Director of Artificial Intelligence at...

What Drives Better Safety Outcomes—Carrot, Stick, or “Zero Harm”?
On paper, construction has never looked safer. In reality, mental health claims are rising, workers are disengaged and the compliance playbook is broken. Garry Mansfield, co-founder of Scratchie, argues the...
Free Tools
Calculators
Use our calculators to estimate the cost of construction materials for your next project.
Templates
Find a template to help you with your construction project tasks.
Material Price Tracker
Get the latest U.S. retail prices and view historical trends for common building materials.
Glossary
Explore key terms and phrases used in the industry.