Procore Company Logo
Back

360 Reporting Visuals & Dashboards

Feature ReleaseDec 16, 2025

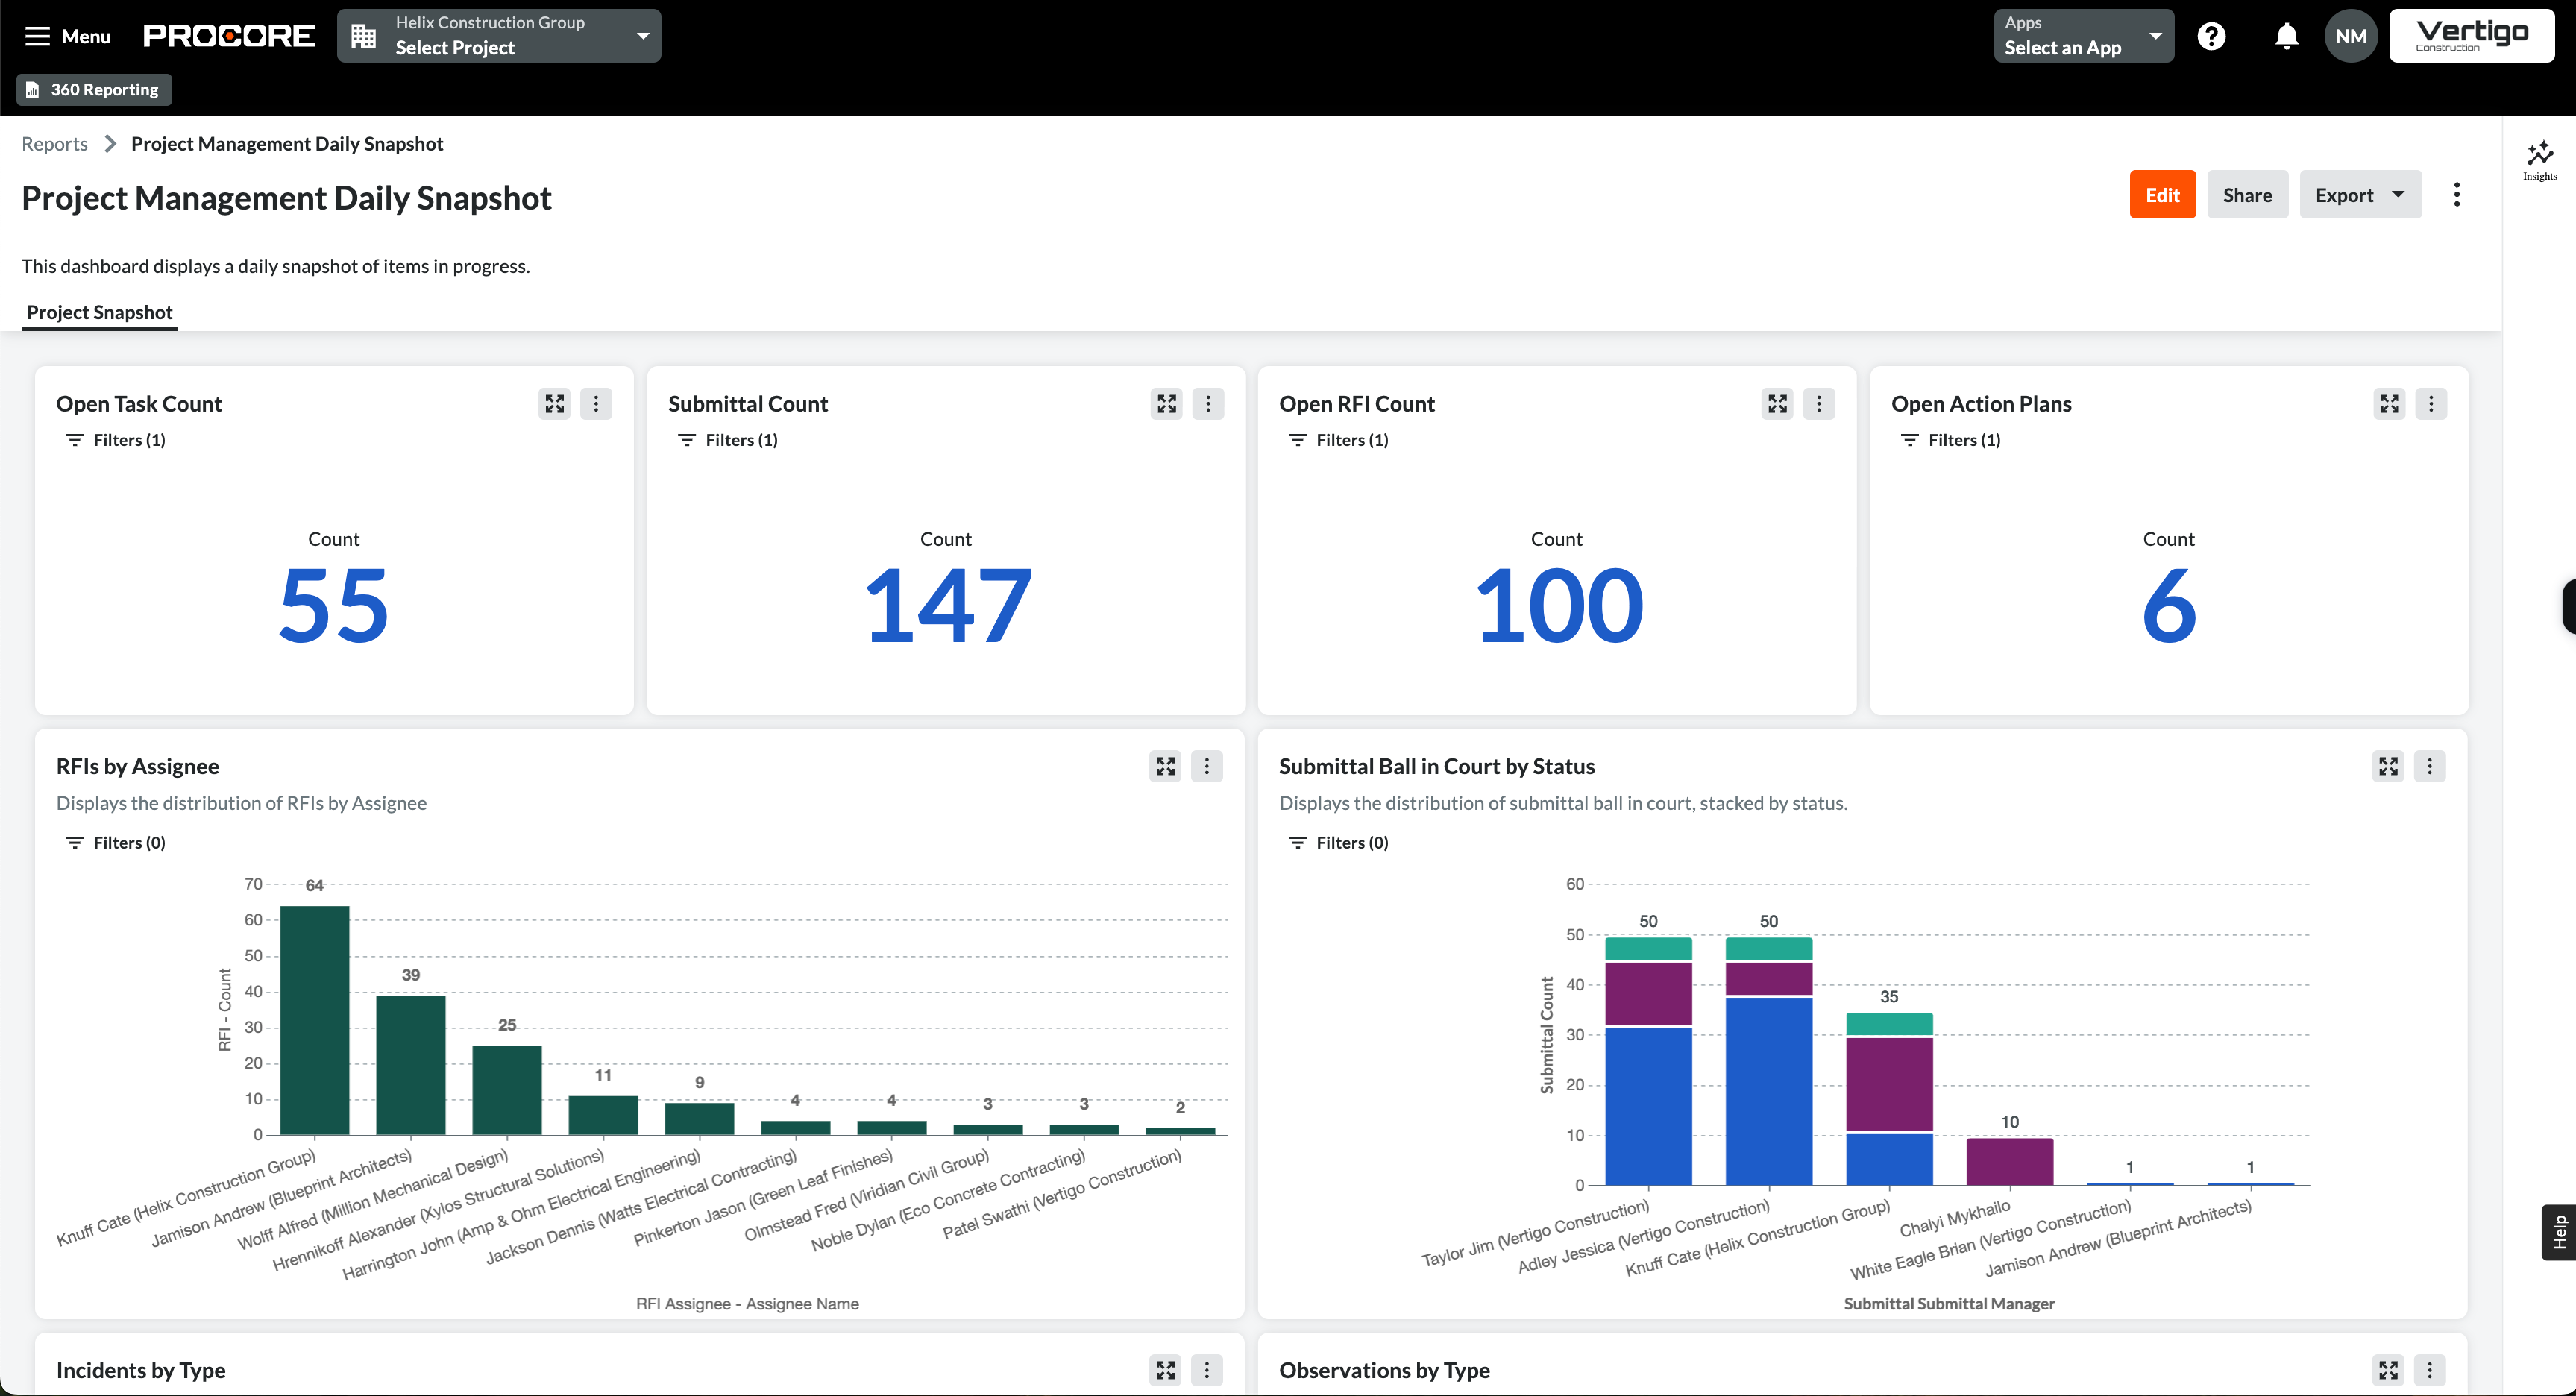
Transform your reporting with 360 Reporting Visuals & Dashboards. Combine charts, graphs, and tables from multiple datasets into a single, customizable dashboard. Instantly visualize key metrics, resize and reposition visuals, and gain actionable insights at a glance—empowering faster, data-driven decisions for your projects.
Learn more

  • Manage Features With Procore Explore
  • Overview
  • Overview
  • What visual types can I create with 360 Reporting Visuals and Dashboards? (Beta)

Start growing with Procore today.

With tools to make every part of your process more human and a support team excited to help you, getting started with any project has never been easier.