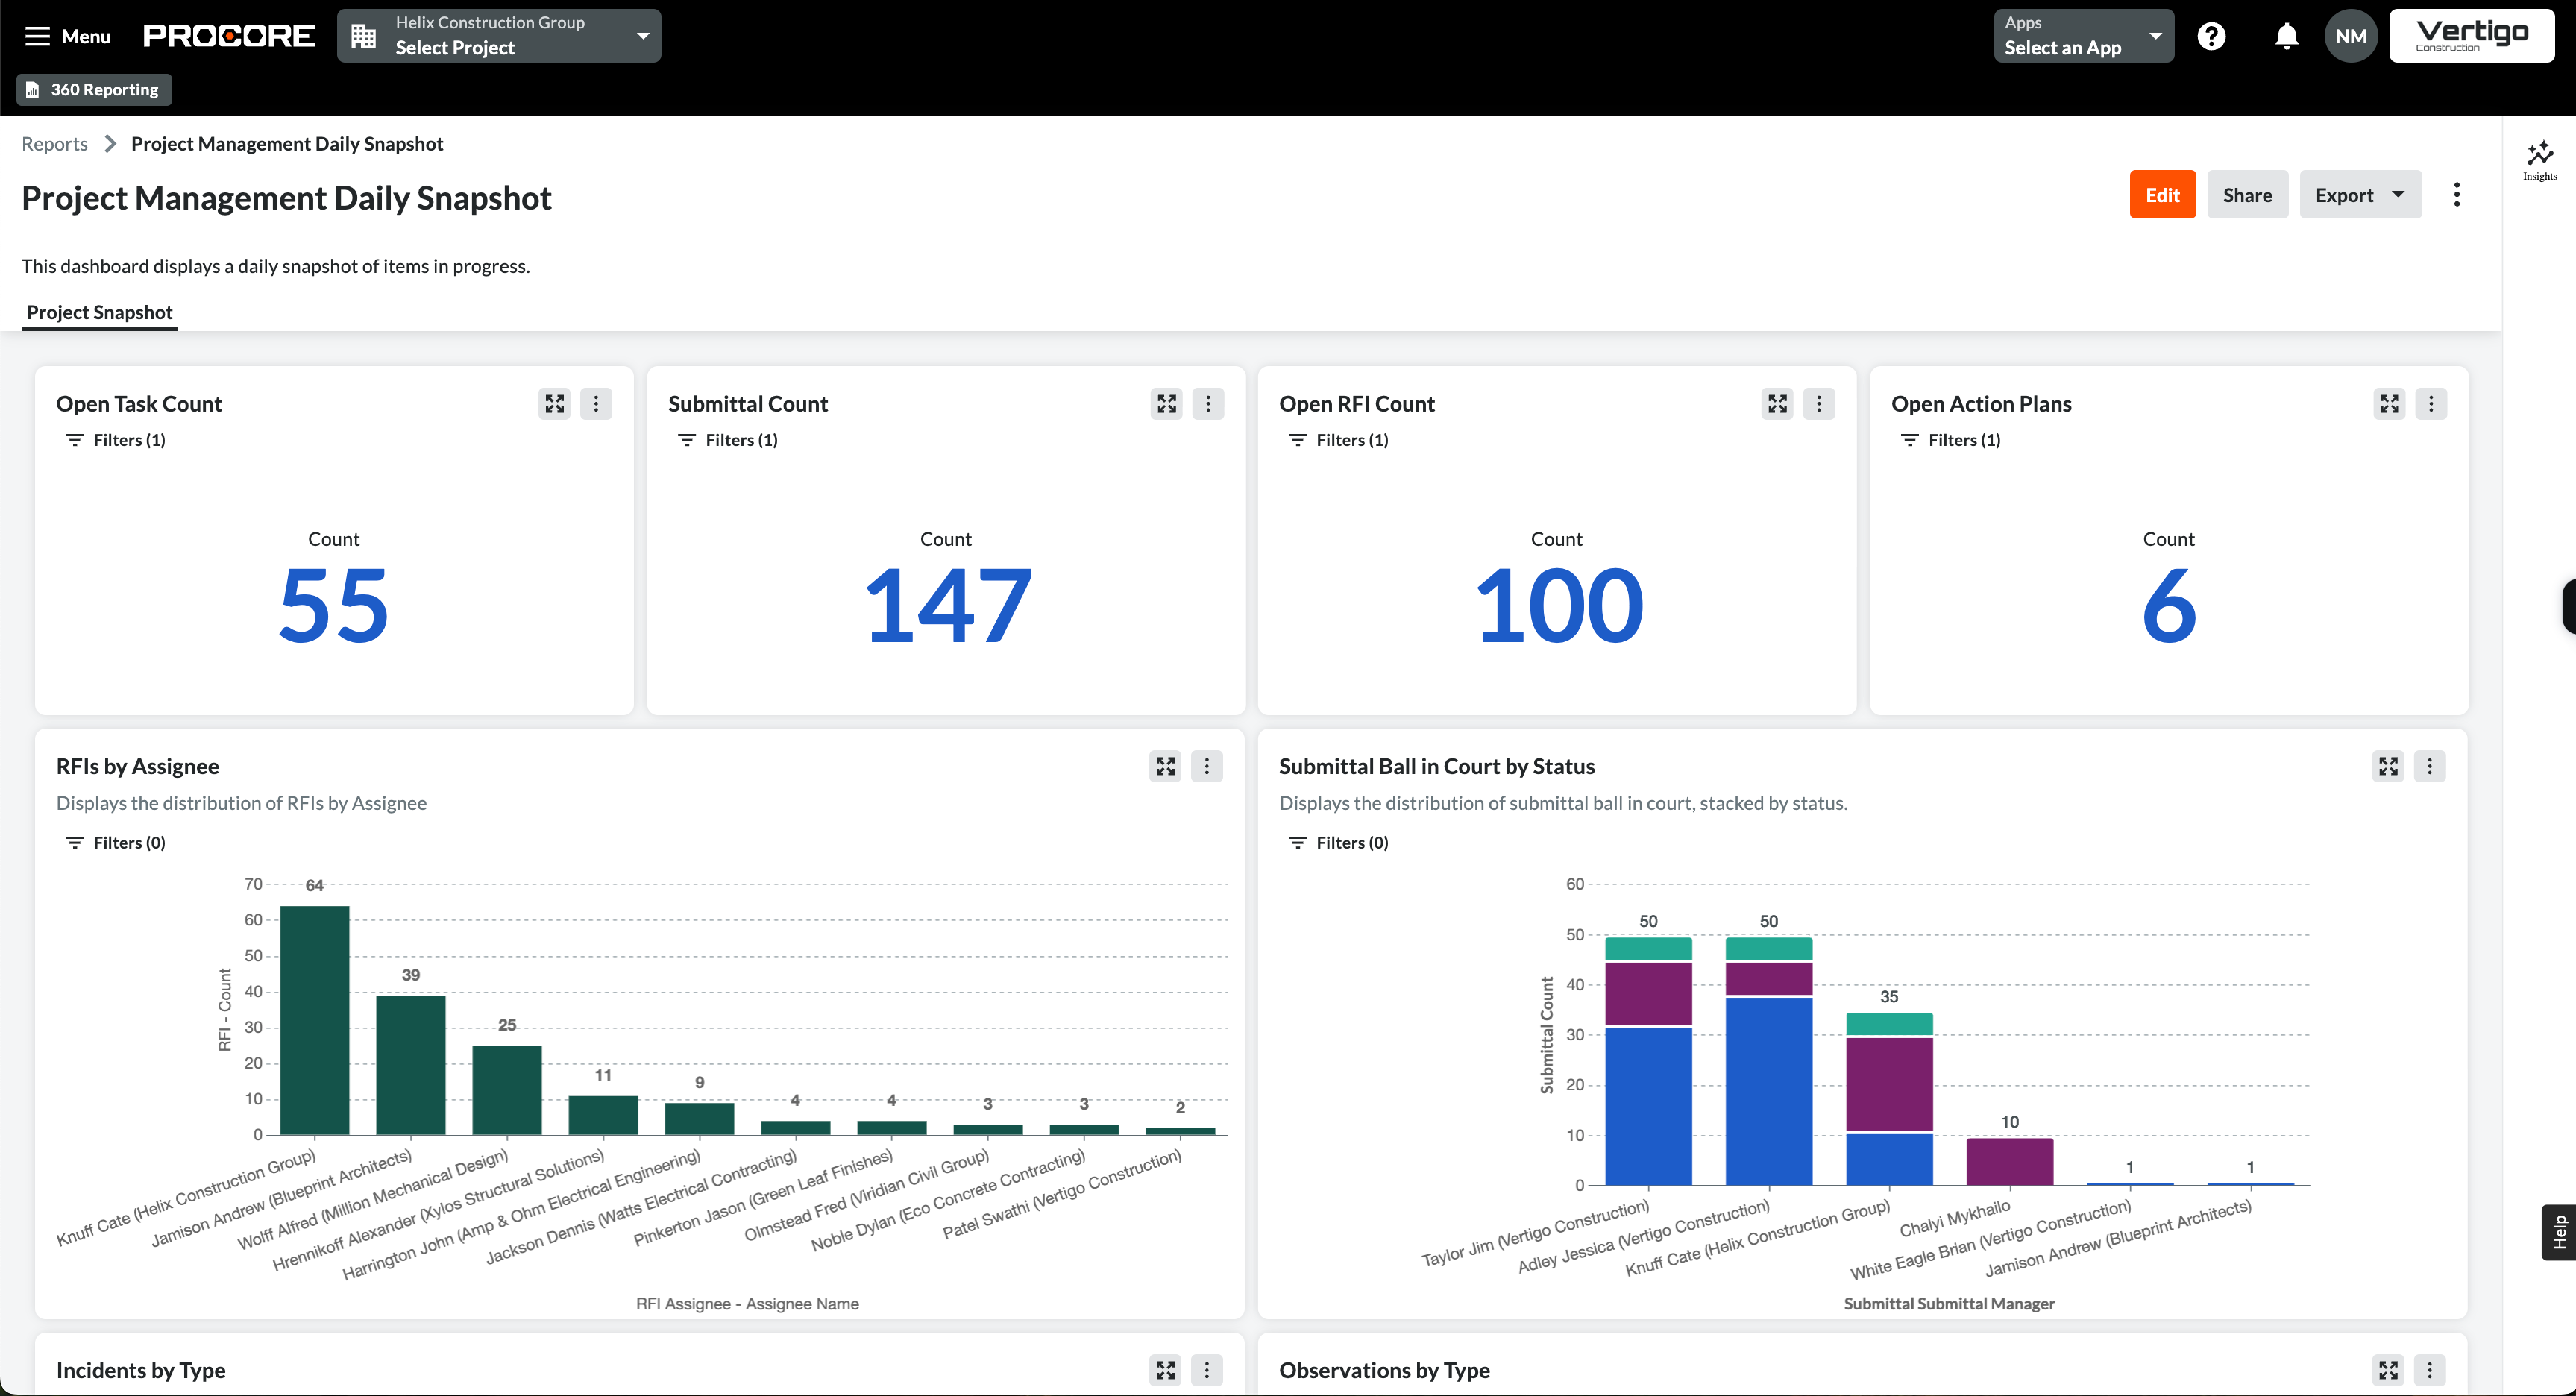
Transformieren Sie Ihre Berichterstattung mit 360 Berichterstattung Visuals und Dashboards. Kombinieren Sie Diagramme, Grafiken und Tabellen aus mehreren Datensätzen in einem einzigen, anpassbaren Dashboard. Visualisieren Sie sofort wichtige Kennzahlen, ändern Sie die Größe und Position von Visuals und gewinnen Sie umsetzbare Erkenntnisse auf einen Blick – für schnellere, datengestützte Entscheidungen für Ihre Projekte.