Procore Company Logo
Back

360 Reporting Visuals & Dashboards

Feature Release16 Dec 2025

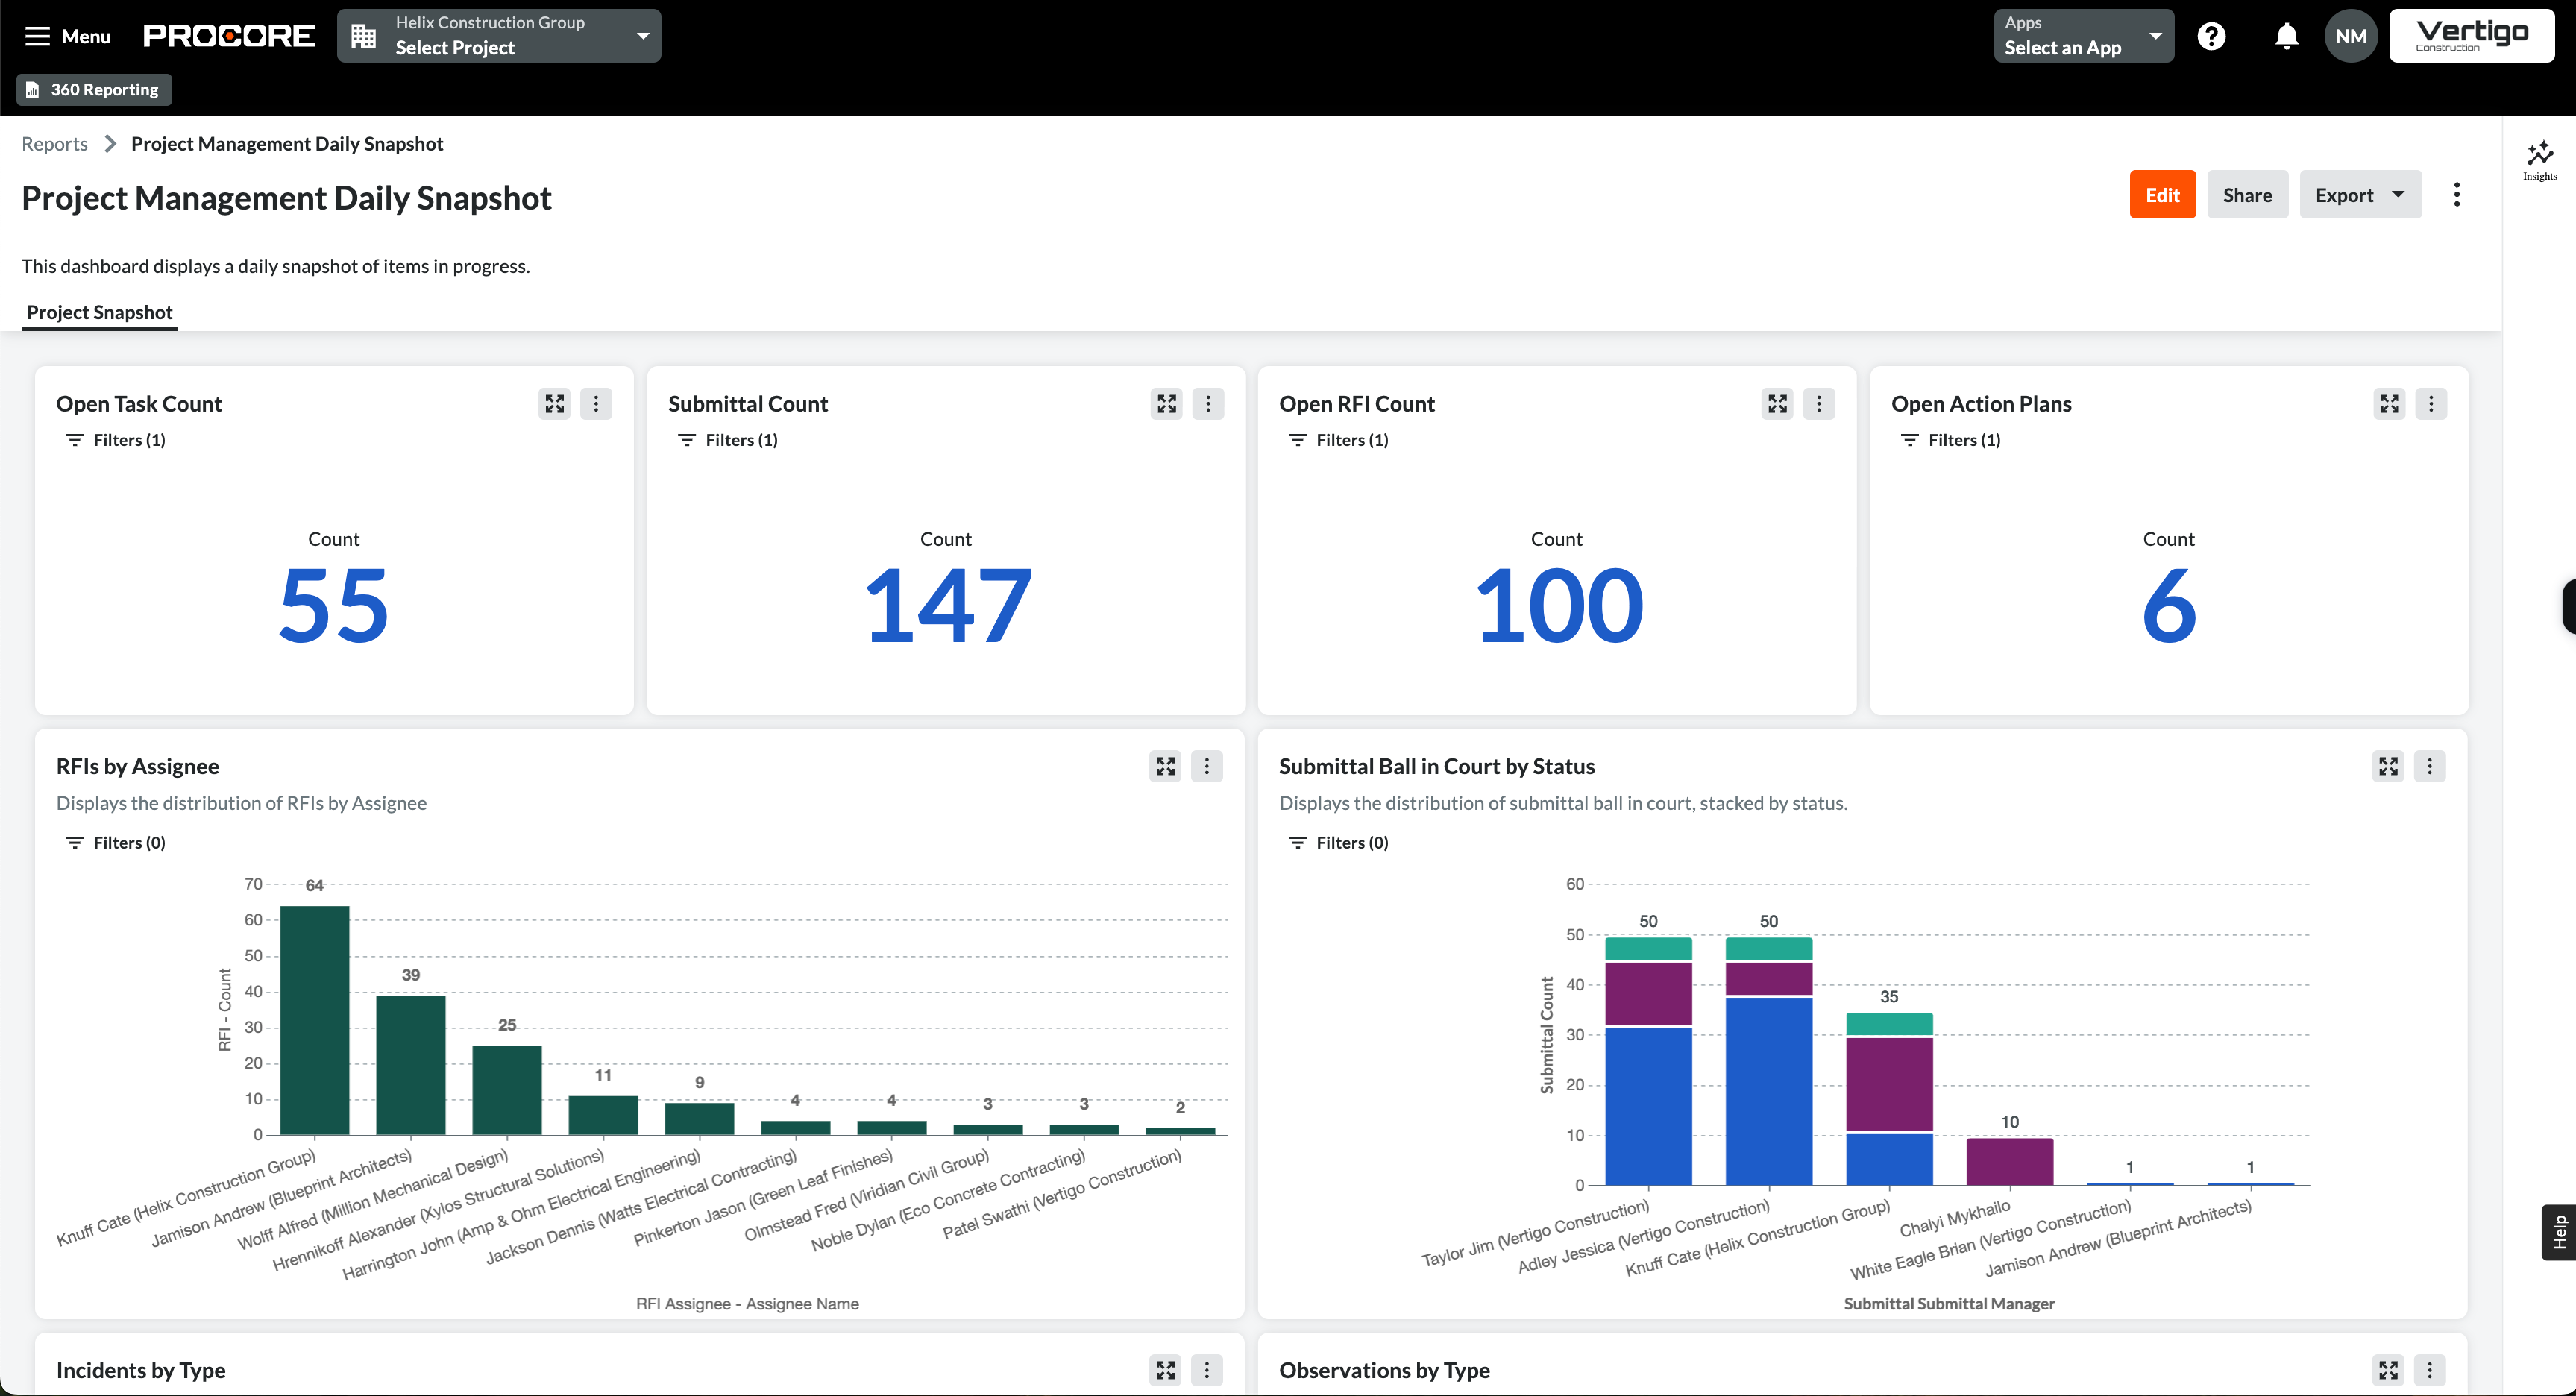
Transform your reporting with 360 Reporting Visuals & Dashboards. Combine charts, graphs and tables from multiple datasets into a single, customisable dashboard. Instantly visualise key metrics, resize and reposition visuals and gain actionable insights at a glance—empowering faster, data-driven decisions for your projects.

Learn more

  • Manage Features With Procore Explore
  • Overview
  • Overview
  • What visual types can I create with 360 Reporting Visuals and Dashboards? (Beta)

Join 3M daily users who build better with Procore.

4.5(2,656)

4.6(41K)

4.6(43K)

4.1(3,100)